Signs at Crosby
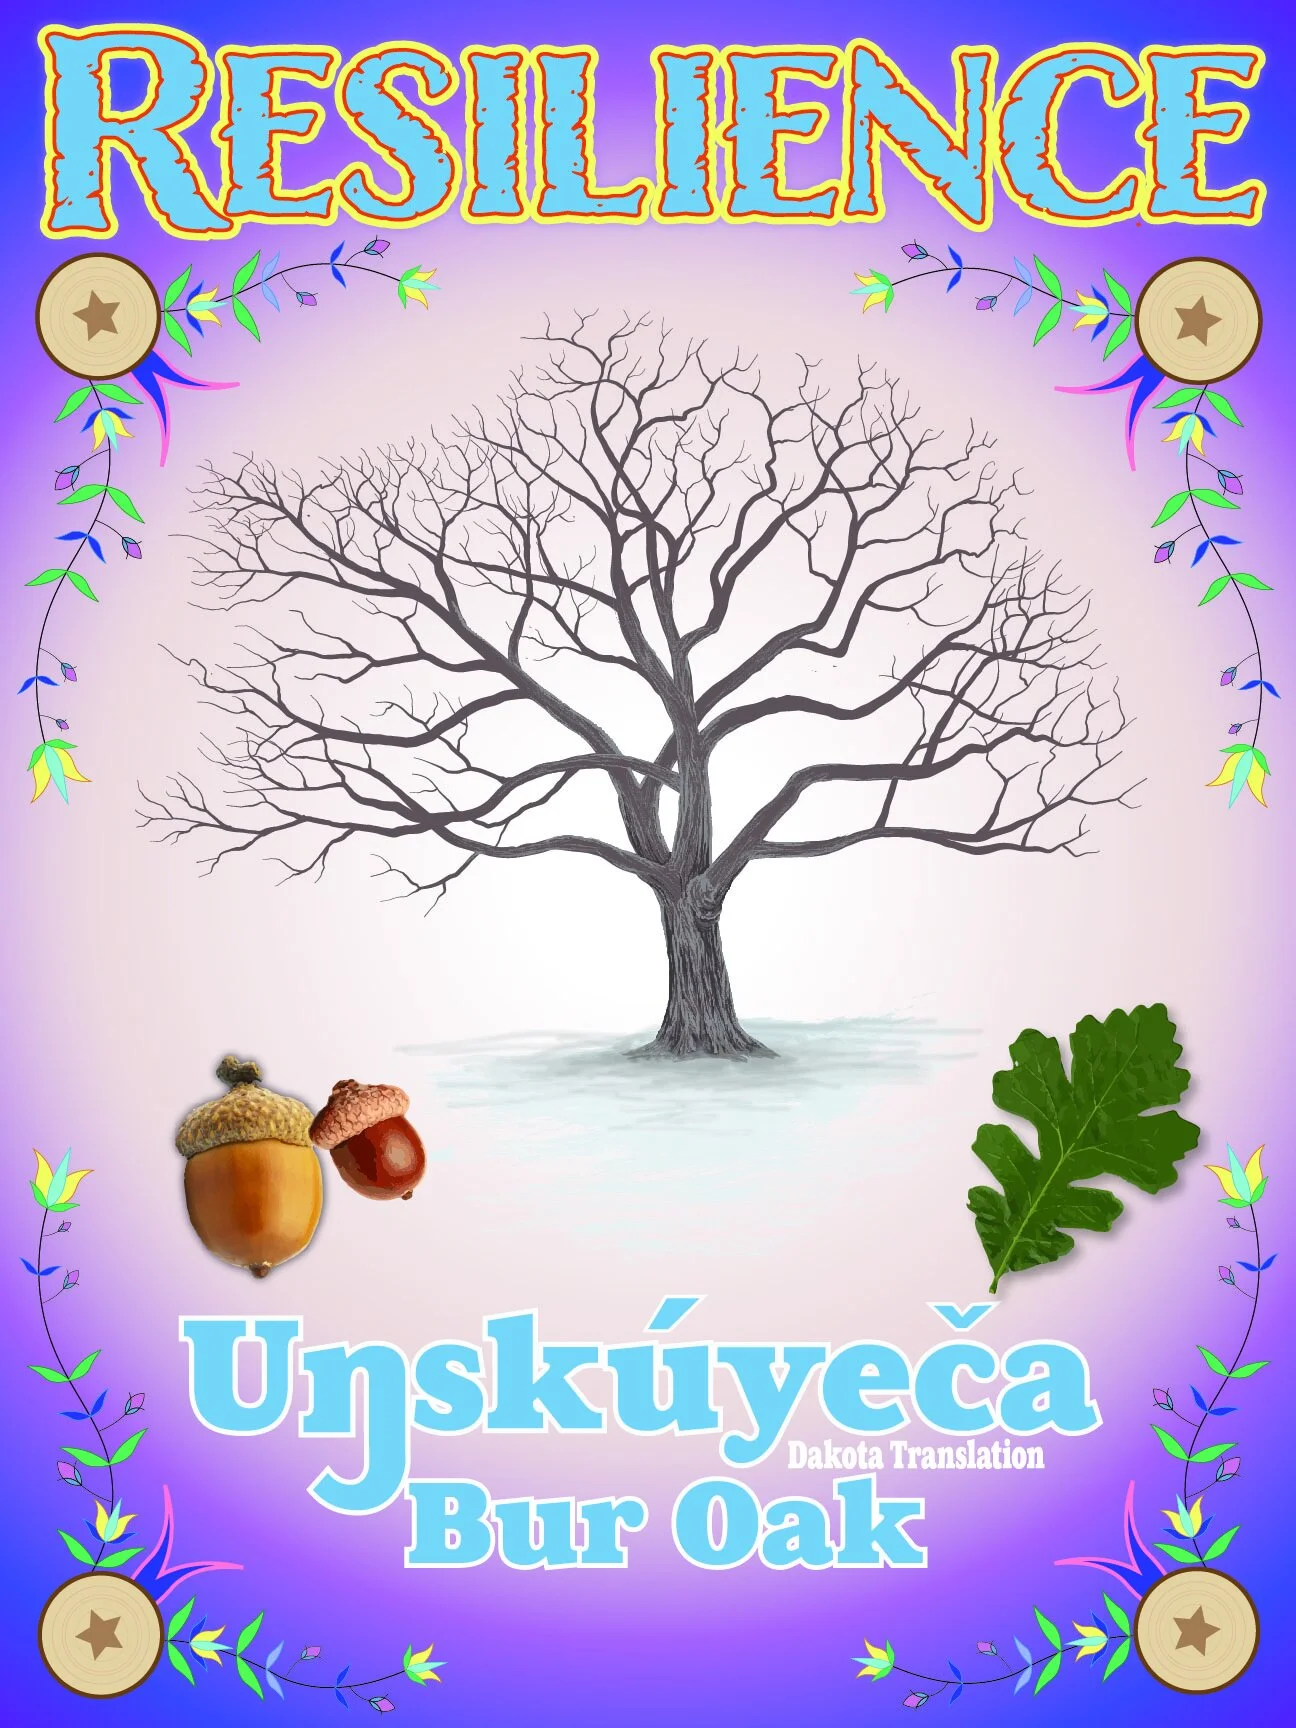
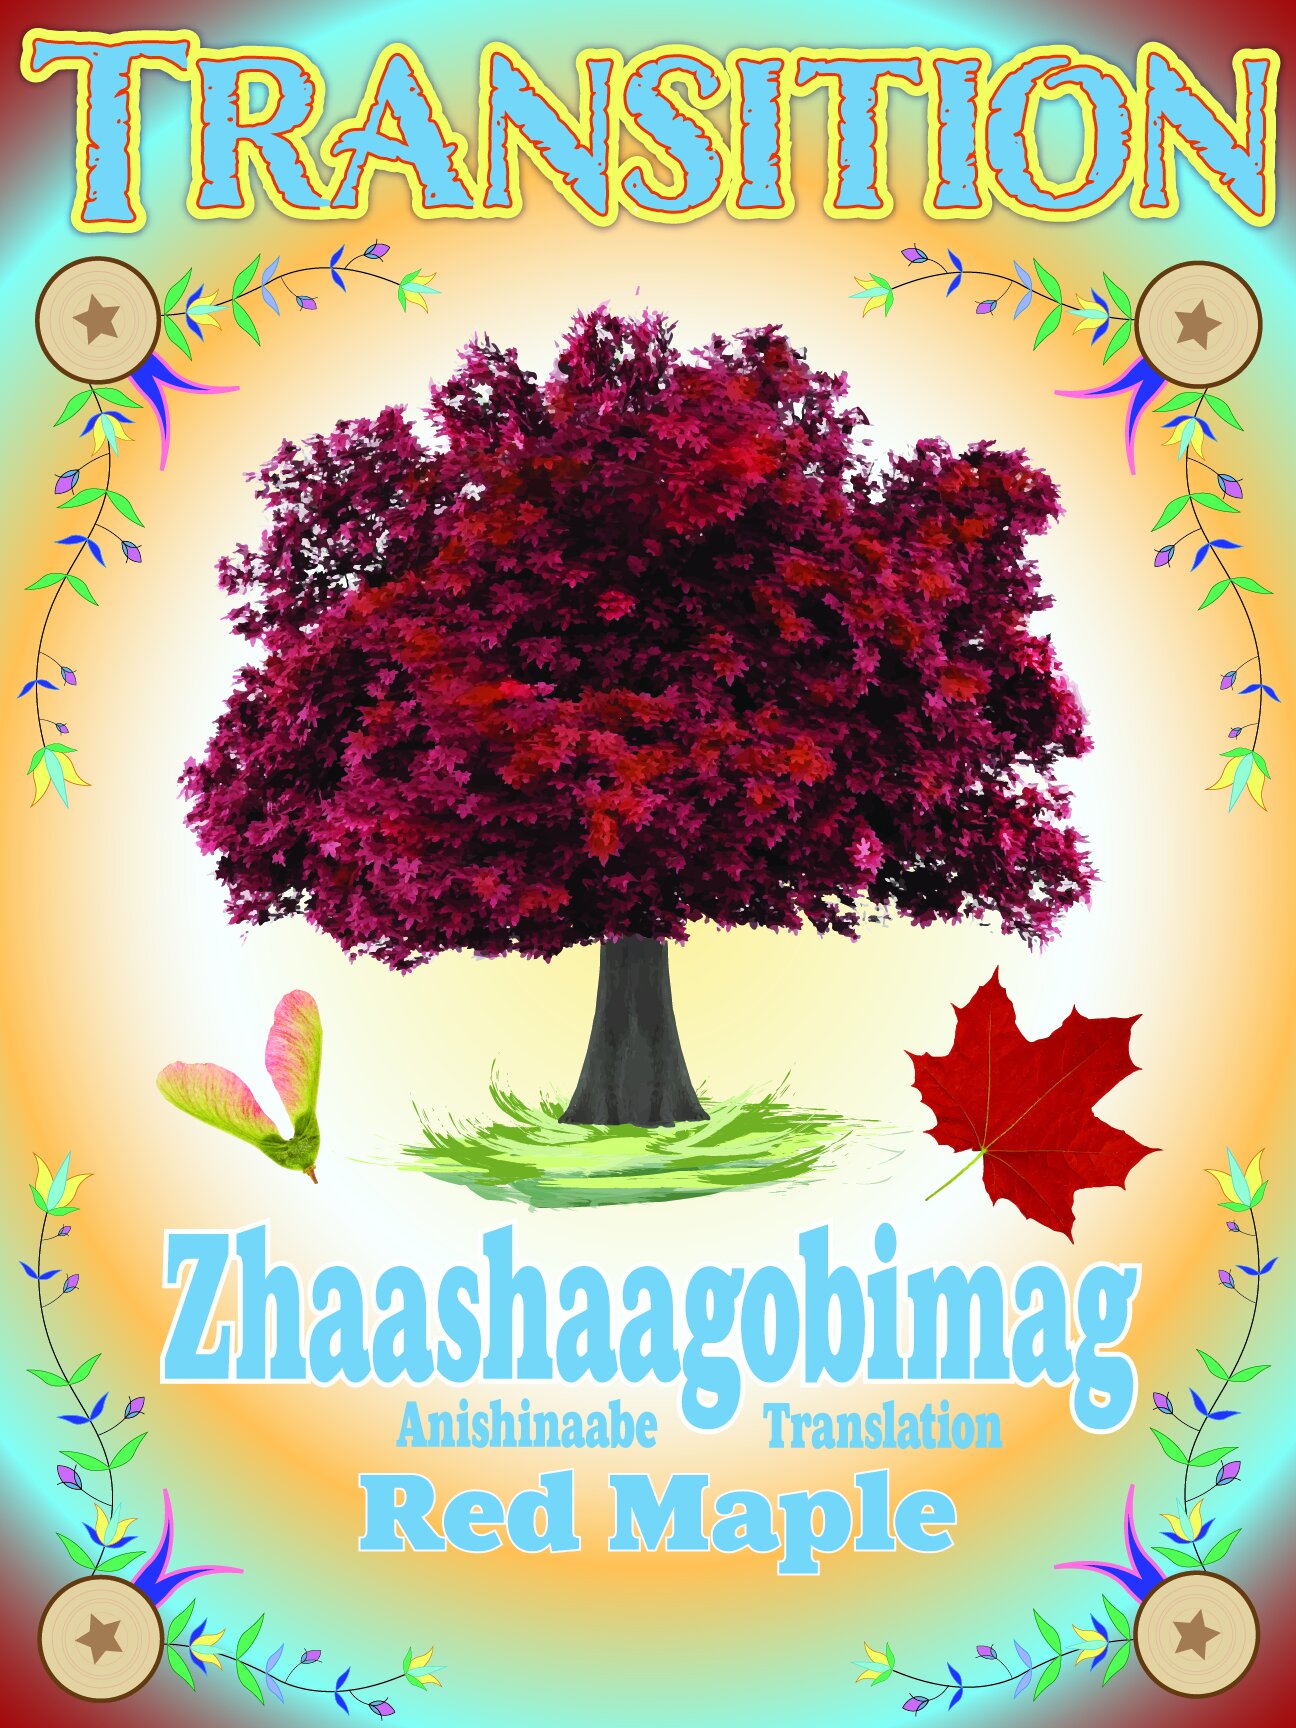
In 2022, we installed signs to share the project with visitors at Crosby. The signs represent the three treatments that are being tested in the experiment: resistance, resilience, and transition (there is also a control group). The three types of plots not only contain different tree species, but also different approaches to managing forest structure. The number of large trees, for example, influences the amount of sunlight available to seedlings and understory plants.
Willard Malebear, a local Indigenous artist, created the artwork. His work illustrates Dakota florals and three of the 14 tree species that are growing in the research plots that are significant in Dakota and Ojibwe cultures. The interpretive messages were developed in partnership with Wakan Tipi Awanyankapi (formerly known as Lower Phalen Creek Project), a Dakota-led organization based on the east side of Saint Paul.
Resistance Plots:
Consist of trees that currently grow in forested areas along the Upper Mississippi River but may be underrepresented due to challenges in regeneration. The strategy behind this treatment is to maintain the forest's current condition by encouraging these species to regenerate, either naturally or by planting. This includes maintaining large cottonwood and silver maple for wildlife habitat and closed canopy conditions.
Resistance Trees:
Silver maple (Acer saccharinum)
American elm (Ulmus americana)
Eastern cottonwood (Populus deltoides)
Hackberry (Celtis occidentalis)
River birch (Betula nigra)
Swamp white oak (Quercus bicolor)
Resilience Plots:
Contain a greater variety of species native to the Mississippi River that are more flood and drought-tolerant, and may be better adapted to future climate conditions. The underlying strategy is to help the forest withstand potential changes in flooding regime and hydrological changes due to climate change, but encourage an eventual return to its original state.
Resilience Trees:
Silver maple (Acer saccharinum)
American elm (Ulmus americana)
Eastern cottonwood (Populus deltoides)
Black willow (Salix nigra)
River birch (Betula nigra)
Bur oak (Quercus macrocarpa)
American sycamore (Platanus occidentalis)
Swamp white oak (Quercus bicolor)
Transition Plots:
Contain trees that grow further south along the Mississippi River and southern genotypes of current species. This strategy aims to equip the forest for change by promoting species that are adapted to projected future climates.
Transition Trees:
Silver maple (Acer saccharinum)
Red maple (Acer rubrum)
American sycamore (Platanus occidentalis)
River birch (Betula nigra)
Sweetgum (Liquidambar styraciflua)
Southern pin oak (Quercus palustris)
Northern pecan (Carya illinoensis)
Yellow poplar (Liriodendron tulipifera)
Where do the new tree species come from?
(If map doesn’t load properly refresh the page or click here.)
The U.S Department of Agriculture (USDA) plant hardiness zones help gardeners, farmers, and foresters decide which plants will grow best in their regions. The map is based on the average annual extreme minimum winter temperature. However, plants' ideal ranges are shifting due to climate change.
Click the orange slider button on the map above and move the slider from left to right to see how these zones are expected to change in 2040-2069, compared to their distribution in 1980-2009. This map uses a medium climate scenario that predicts greenhouse gas emissions will increase into the middle of the century, when climate policies theoretically eventually cause them to decline.
When the project started, the Twin Cities was classified as Zone 4. Resistance trees came from Zone 4 (light blue), resilience trees from 4 and 5 (light blue and blue green), and transition trees from 5 and 6 (blue green and darker green). As of 2023, the current plant hardiness zone for the Twin Cities is Zone 5.


